Problem Statement
Asthma affects over 25 million individuals in the U.S., leading to significant healthcare visits and emergency care incidents. The challenge is to provide an effective solution for asthma management using wearable technology and a mobile app.
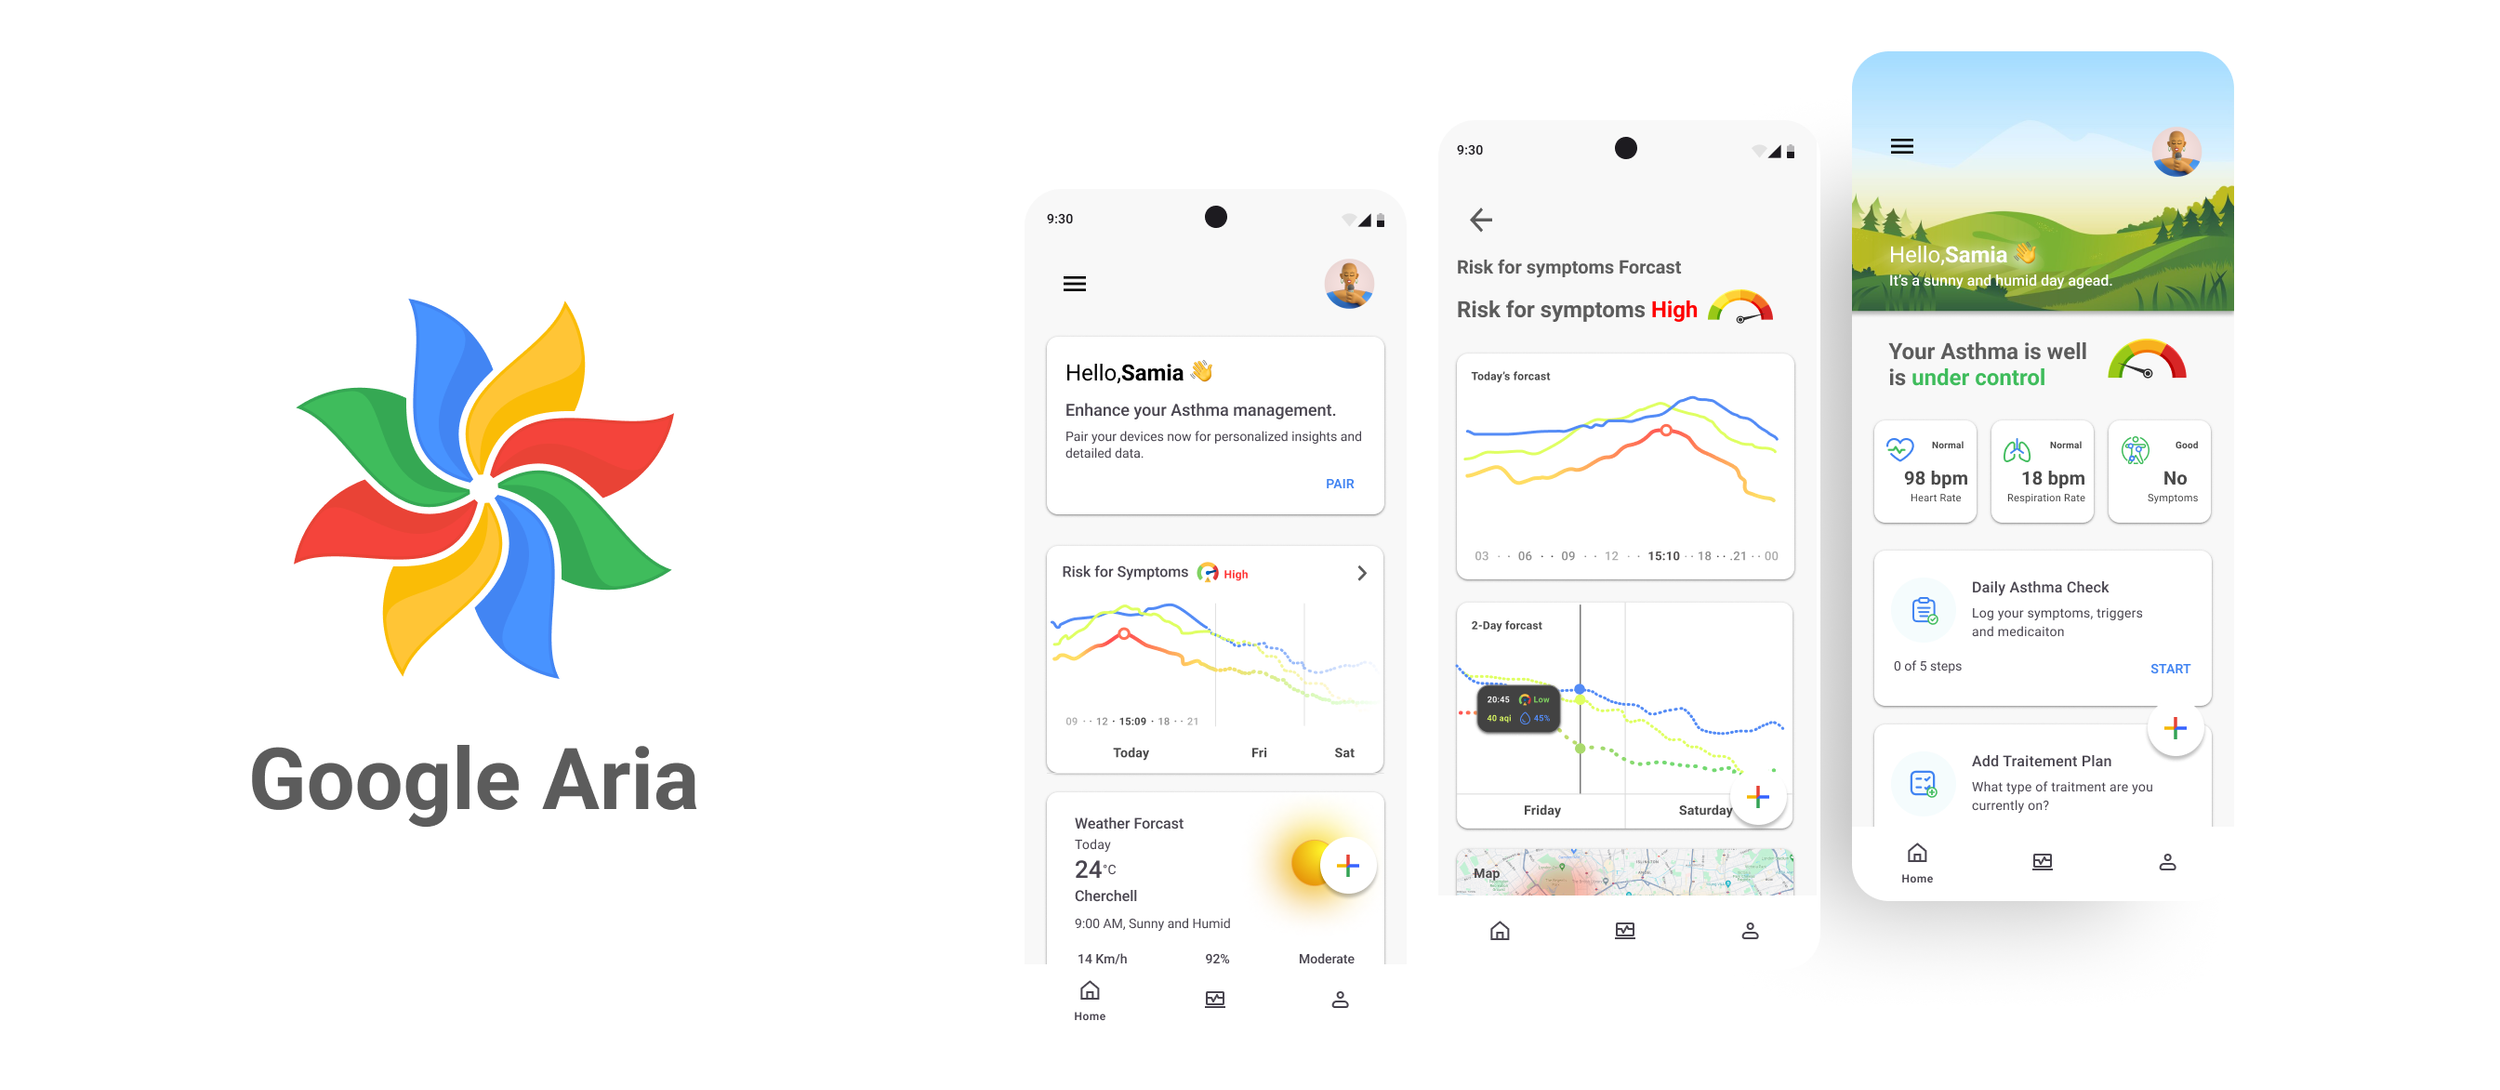
Google Aria's wearable patch, resembling a necklace, monitors heart rate, respiration, wheezing, coughing, sleep, and exercise. It predicts asthma triggers and attacks, reducing management burdens. With sensors for inhalers and a peak flow meter, it tracks medication and lung function via Bluetooth, without manual logging. A mobile app aggregates real-time health data for comprehensive reporting.
Project Goals
Design an Android mobile app for Google Aria that helps users monitor and manage their asthma.
The app should be in line with Material Design and other Google apps.
Design a logo for Google Aria that is also in line with the Google family.
Stage 1 | Discovery
Leveraging my scientific background and expertise in molecular biology, I possessed insights into the mechanisms of asthma and its management. However, recognizing the significance of gaining a clinical perspective, particularly from the viewpoint of healthcare professionals, I devised a research Plan to delve into:
1. Health Impacts of Asthma: Investigating the health effects of asthma, encompassing its diagnosis, various types, symptoms, triggers, and the overarching goals of treatment.
2. Management Practices of Asthmatics: Examining how individuals with asthma navigate their condition, uncovering their needs, challenges, and their strategies for self-management.
3. Physician Monitoring and Progress Assessment: Understanding the methodologies employed by doctors in monitoring a patient's progress, with a focus on vital indicators crucial for tracking advancements in treatment.
4. Patient-Valued Information: Identifying the types of information that hold value for patients in the context of asthma management.
Initiating this exploration, I initiated a comprehensive secondary research phase utilizing online resources. This initial phase aimed to grasp the fundamental importance of asthma management and the crucial role symptom monitoring plays in shaping effective treatment plans.
Subsequently, I conducted a thorough competitor analysis, scrutinising both direct and indirect industry players. This analysis encompassed a review of their solutions, app features, interface design, customization functionalities, pricing structures, and overall availability in the market.
To gain a deeper understanding of asthma treatment procedures, I consulted with Dr. Amine Houaoura, a renowned specialist in internal medicine at CHU Bab El Oued Hospital, and Dr. Ali Ouldslimane, a General Practitioner at Sidi Ghiles Hospital. These discussions provided valuable insights into available treatments, symptom management strategies, recommended devices, and vital signs monitoring techniques.
Key Finding
Research findings suggest that an application solely reliant on device usage may not suit all asthma patients, given the variability in illness severity and unique instrument requirements of their conditions. Therefore, while the app should integrate sensor data for vitals monitoring, it should also support asthmatics without wearables. The aim is to aid in developing sustainable self-management practices for a diverse range of users.
After identifying the issues that required resolution, I created a user experience strategy map (UX strategy Bleuprint) to outline the project's foundation. This map defined the guiding principles, challenges, aspirations, focus areas, activities, and success measurement
Stage 2 | Define
Synthesising user research findings
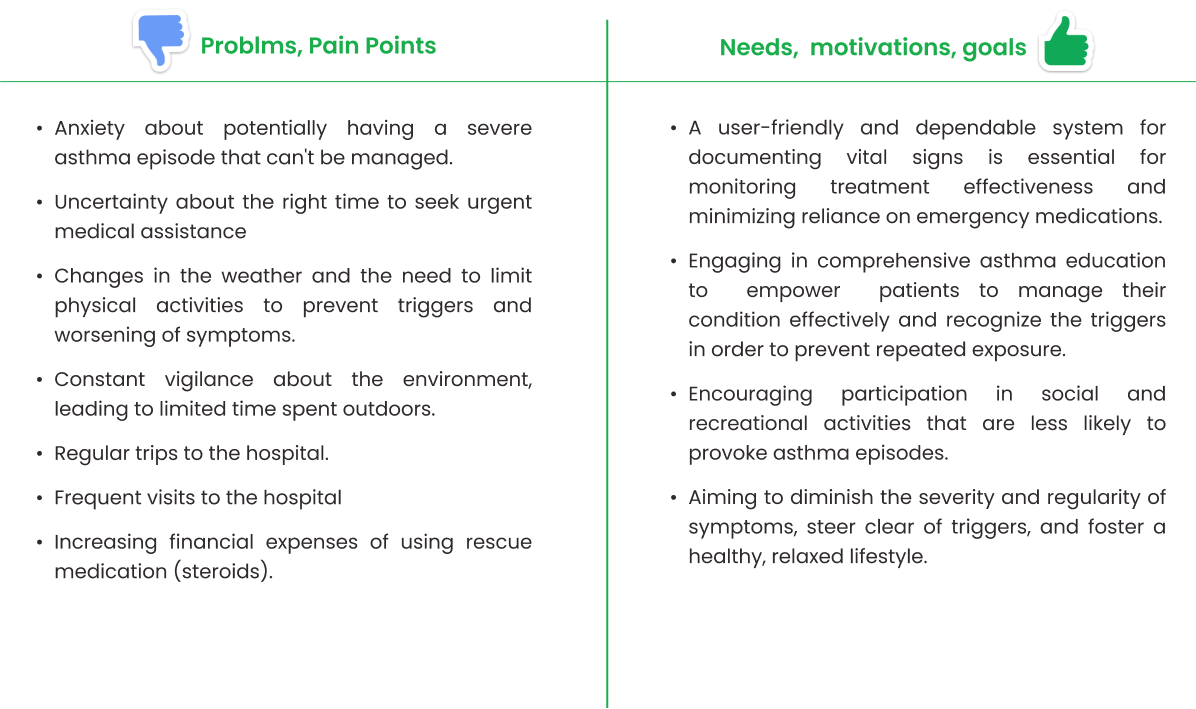
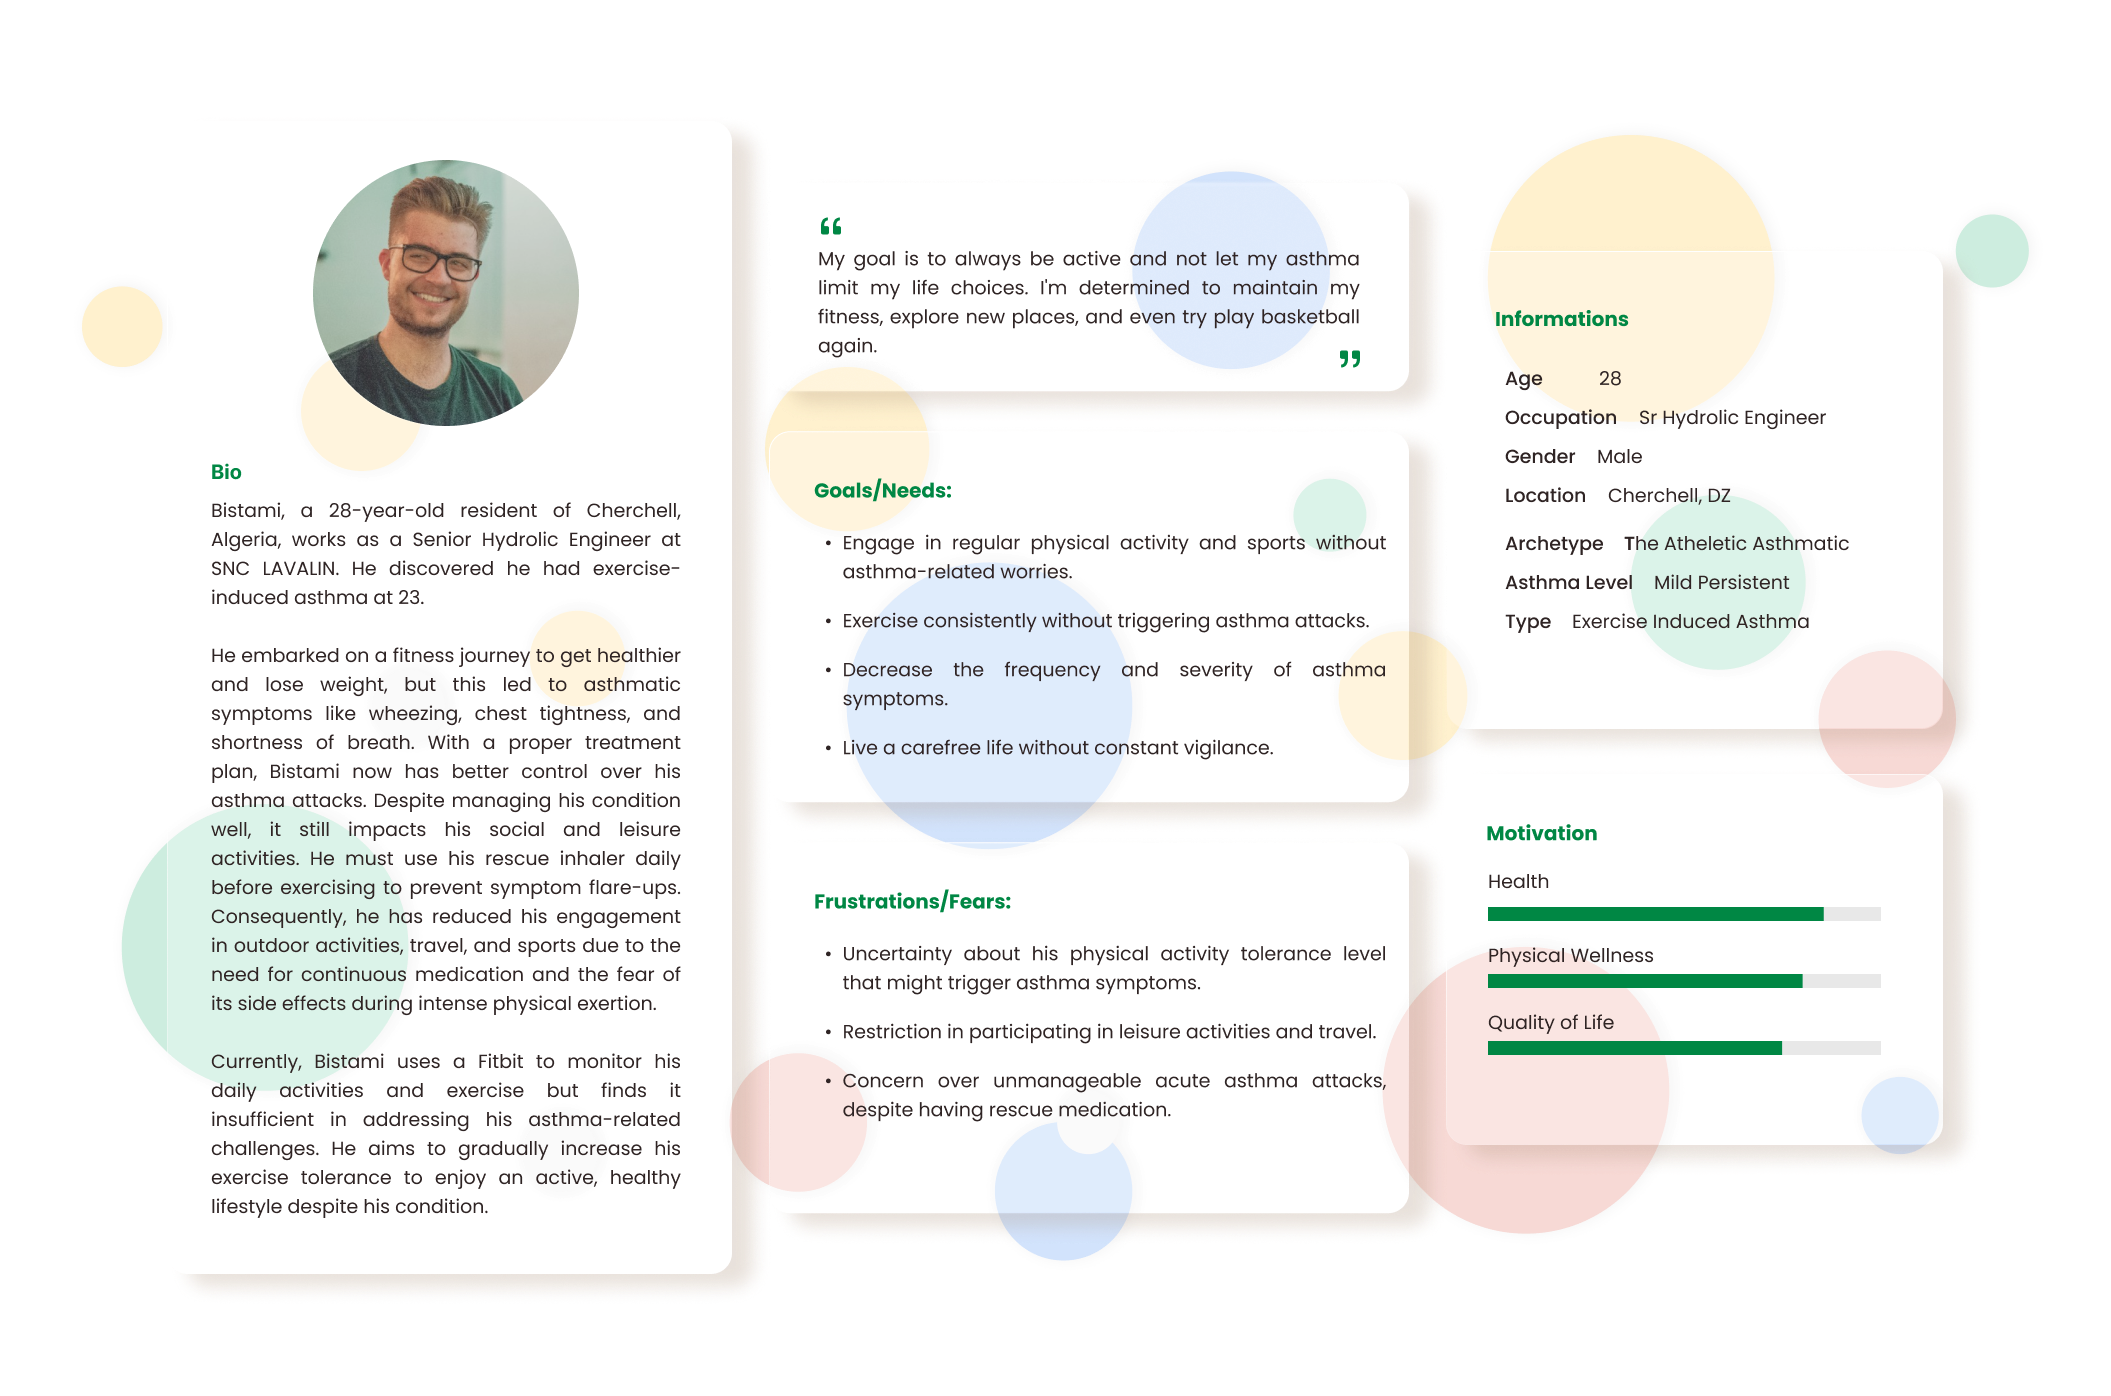
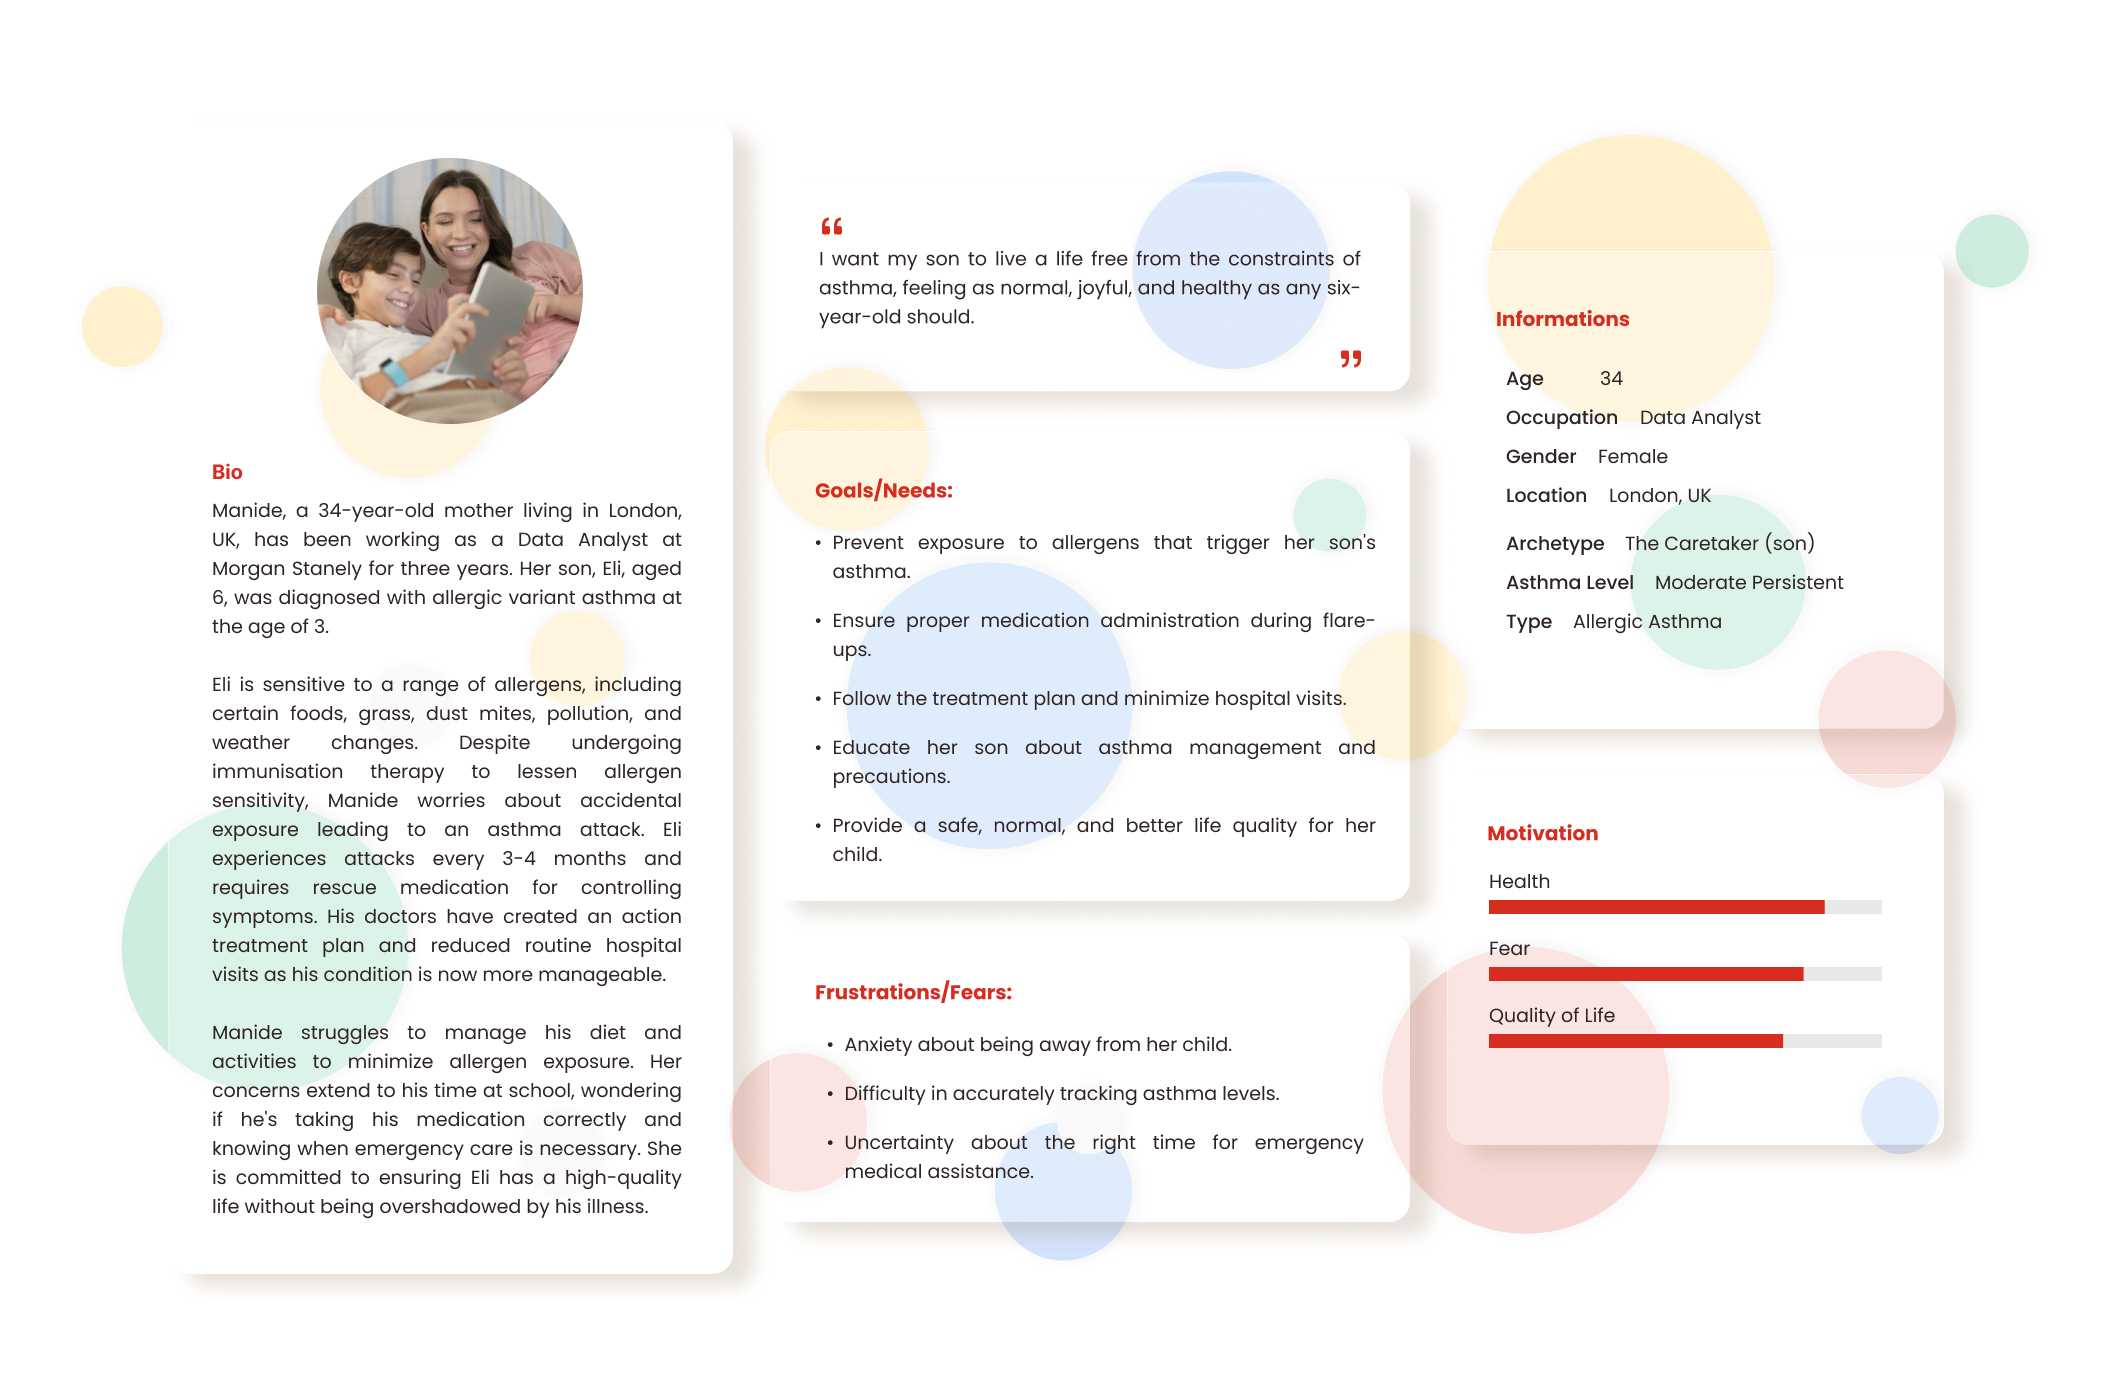
Through my research, I discovered two key user types: an individual with asthma and someone responsible for caring for an asthma patient. To understand their perspectives, I developed detailed persona profiles and empathy maps. These were based on a comprehensive analysis of data gathered from user interviews and secondary research.
Using insights gathered from the personas, I developed Point of View POV statements that served as the foundation for crafting actionable How Might We (HMW) statements. These HMW statements provided direction in shaping the Minimum Viable Products (MVPs) and facilitated brainstorming for optimal solutions to each design challenge. To further clarify the functionality of MVP features, I crafted a Product-Service Ecosystem Map. This map illustrates the interrelation among users, device types, information exchanged, and the services offered within the application.
Persona 1: The Asthmatic Athlete
Persona 2: The Caretaker Mom
Mid Fidelity wireframes
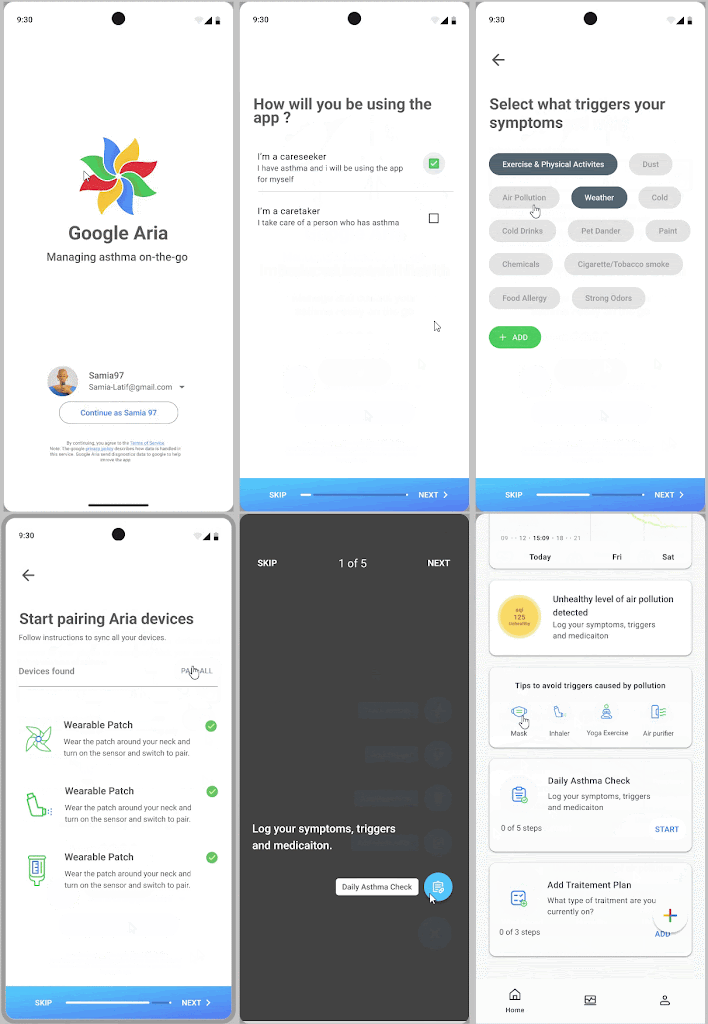
Flow 1 : Onboarding
Stage 3 | Ideate
Synthesising user research findings
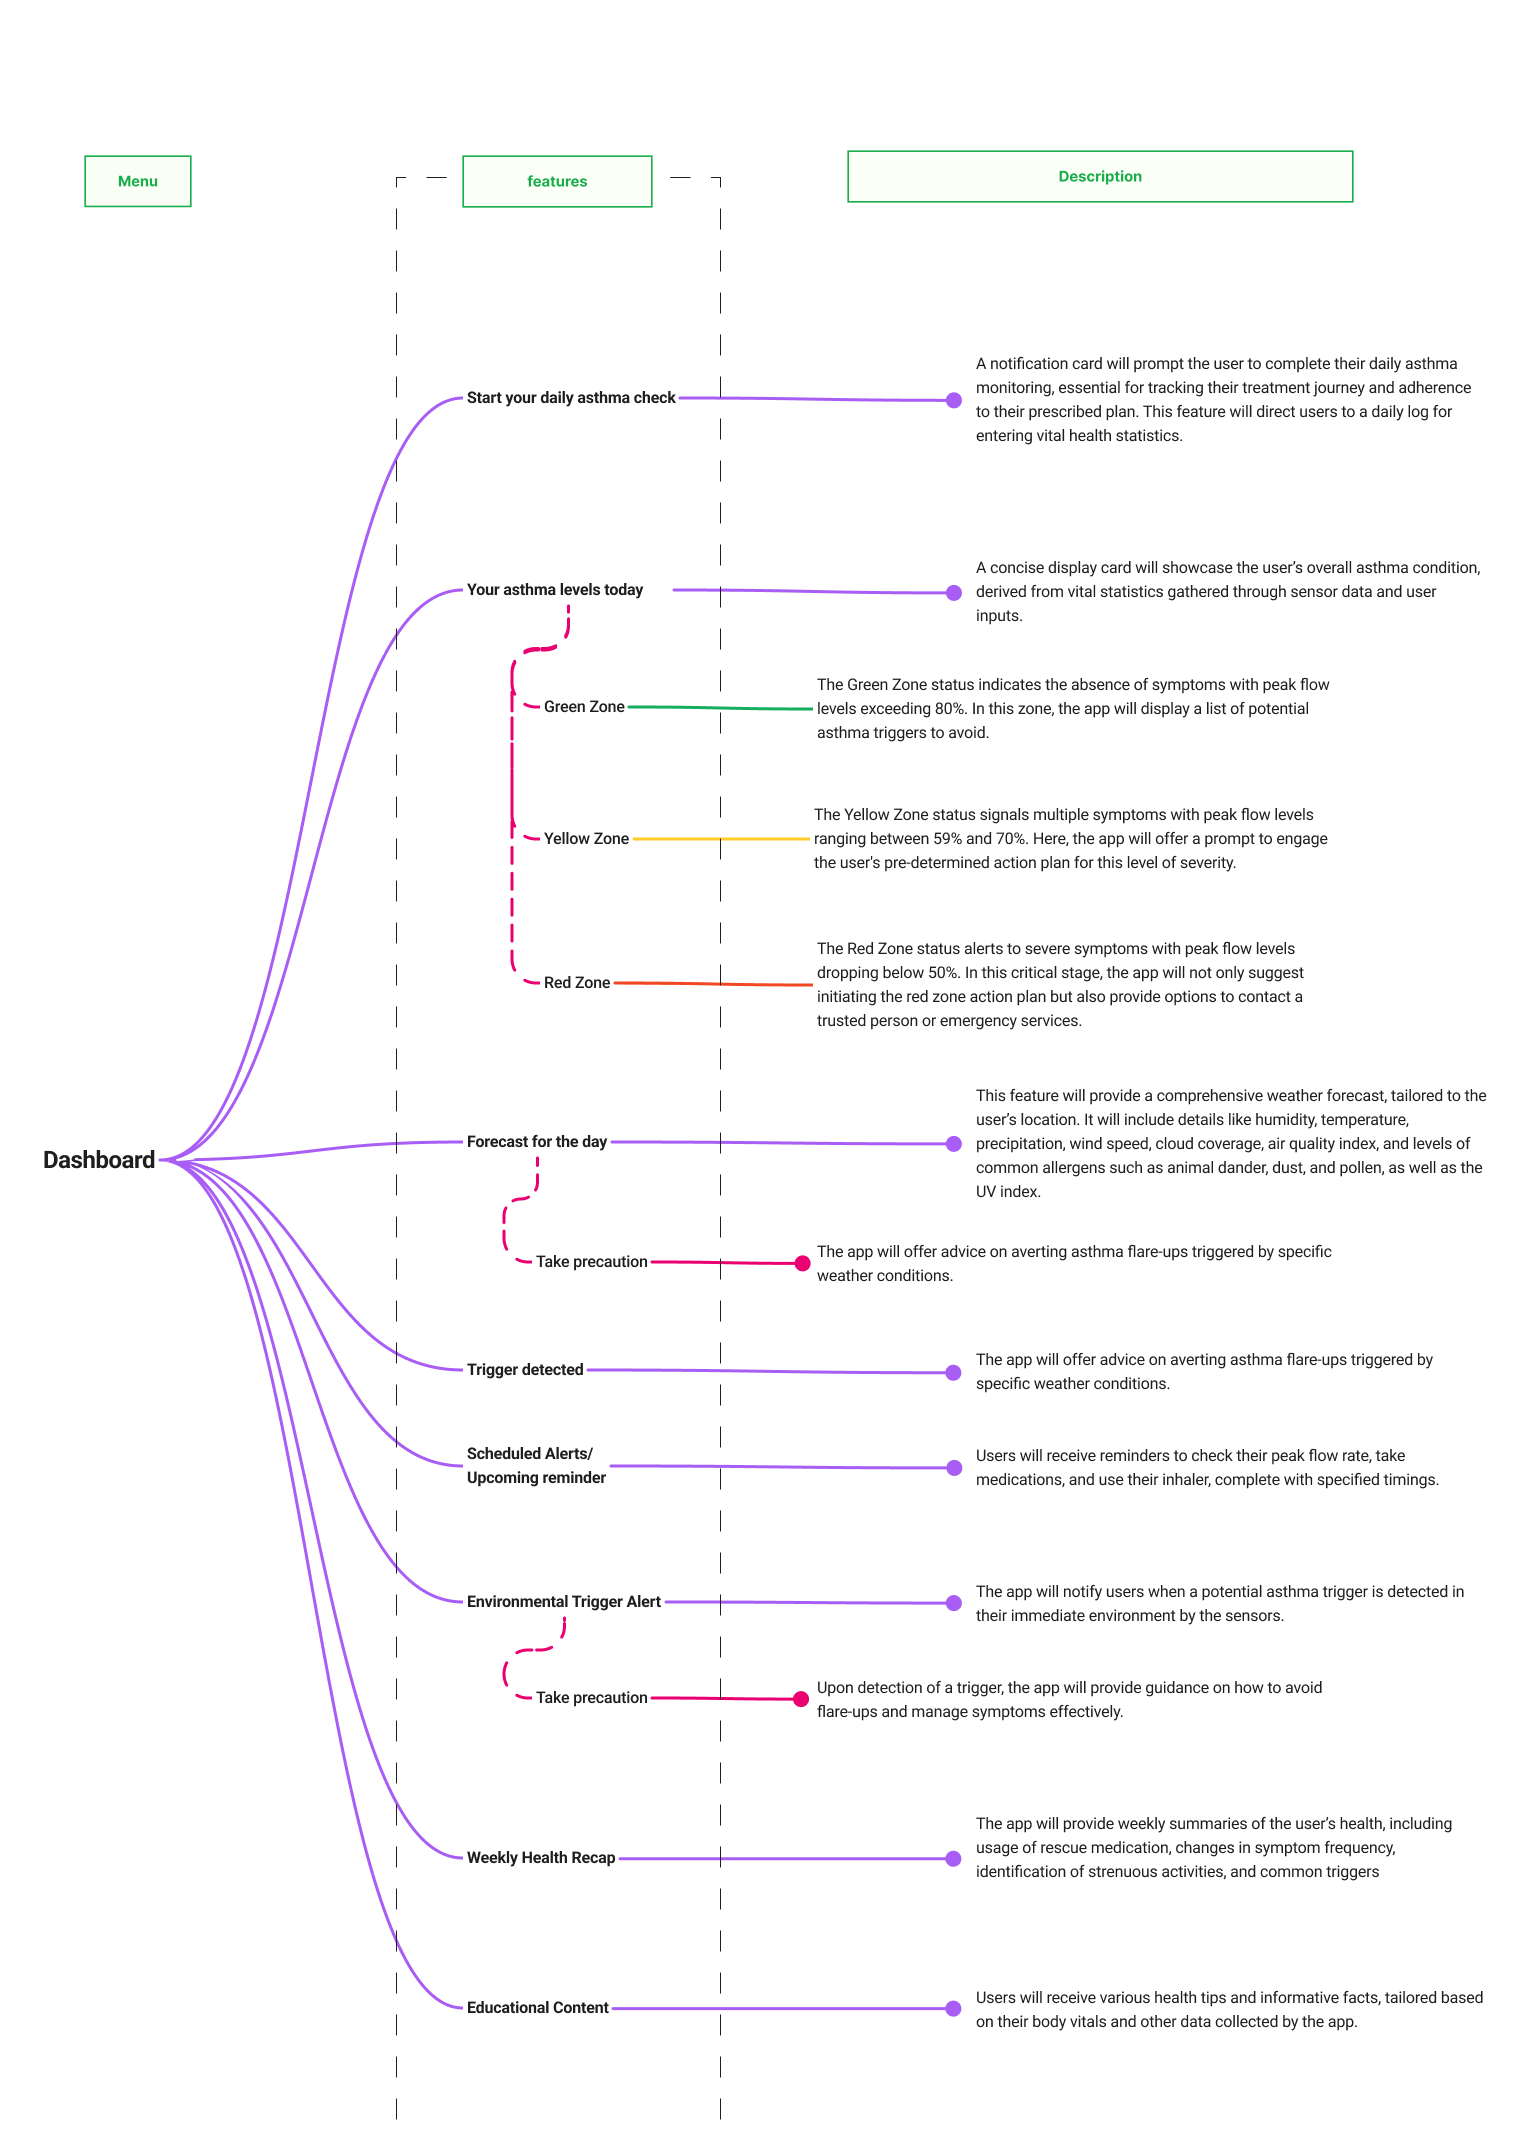
I've developed a product feature map outlining high-priority features essential for key task flows within the application. These features are crucial for the effective use of the app by all individuals managing asthma.
Once the user flows were established, I proceeded to expand on the wireframes for each task. Throughout the design process, my focus remained on creating a user-friendly microcopy interface. This emphasis on clarity and ease of interaction aimed to facilitate swift task completion and promote adherence to the treatment plan.
Branding
In conceptualising the logo for my asthma management and monitoring app, I delved into symbols that intricately reflect the essence of airflow. Drawing from this thematic core, I envisioned a logo that encapsulates both the dynamic motion and gentle circulation synonymous with breathing patterns. Thus, I melded two iconic representations of airflow - the timeless pinwheel and the ubiquitous fan - into a harmonious visual synthesis.
The pinwheel, with its gracefully spinning blades, evokes a sense of fluidity and movement, mirroring the natural rhythm of breath. Its whimsical charm captures the essence of airflow in a manner that resonates with users, conveying a feeling of lightness and ease.
Complementing this, the incorporation of a fan symbolizing not only airflow but also technological advancement traditional care and digital solutions.
By intertwining these two symbols and utilizing Google's color palette, I ensured seamless integration within the broader ecosystem of Google apps and create a logo that not only visually represents airflow but also evokes a sense of reliability, innovation, and user-centric design
Mid Fidelity wireframes
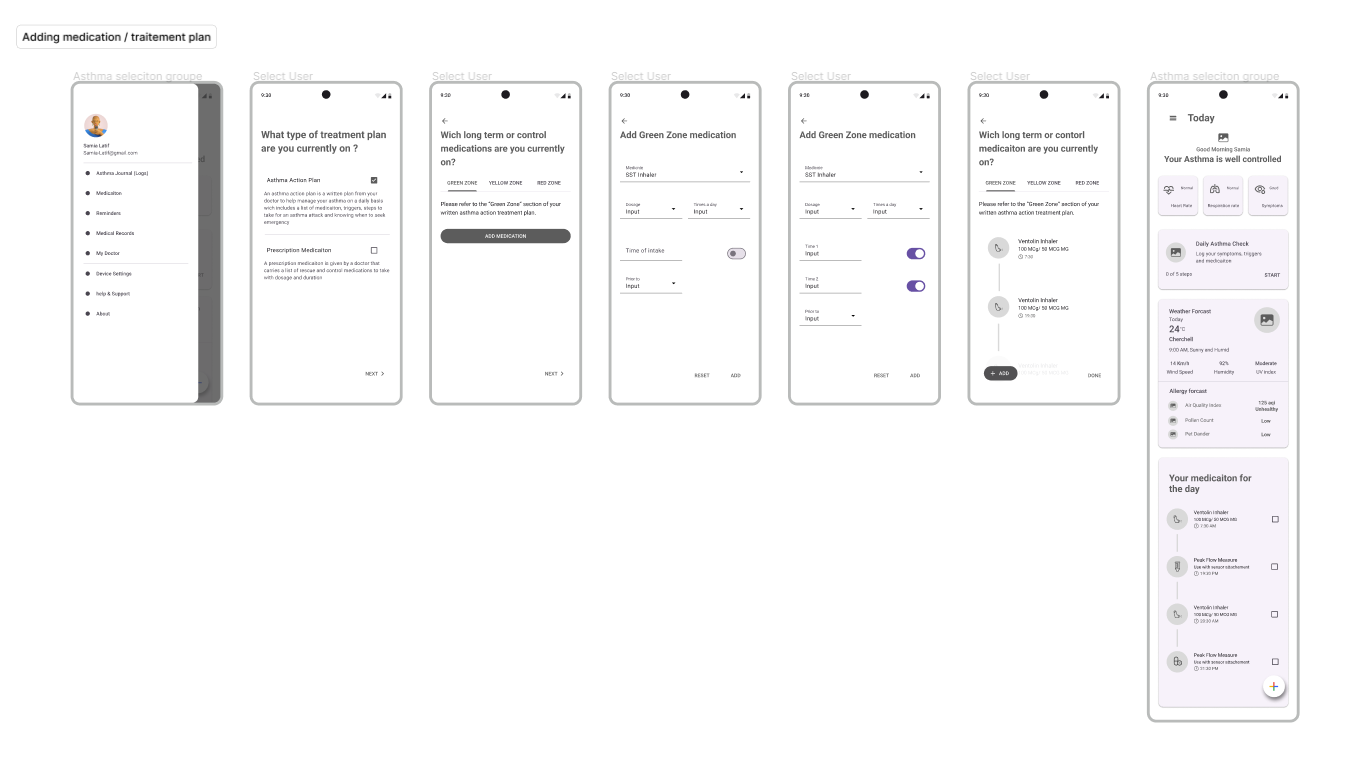
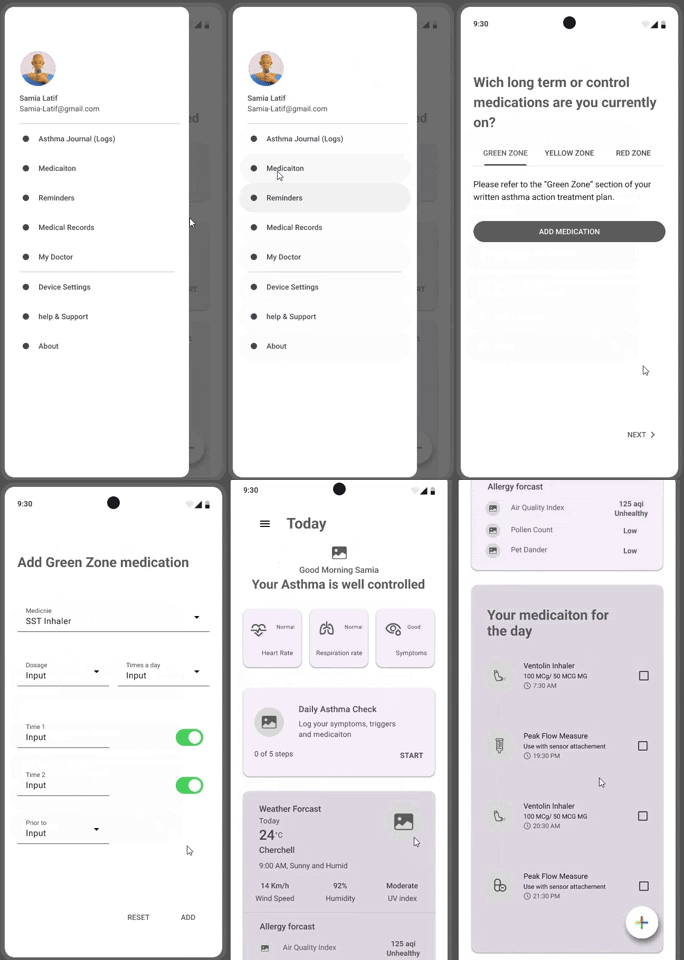
Flow 2: Add Medicaiton
Mid Fidelity wireframes
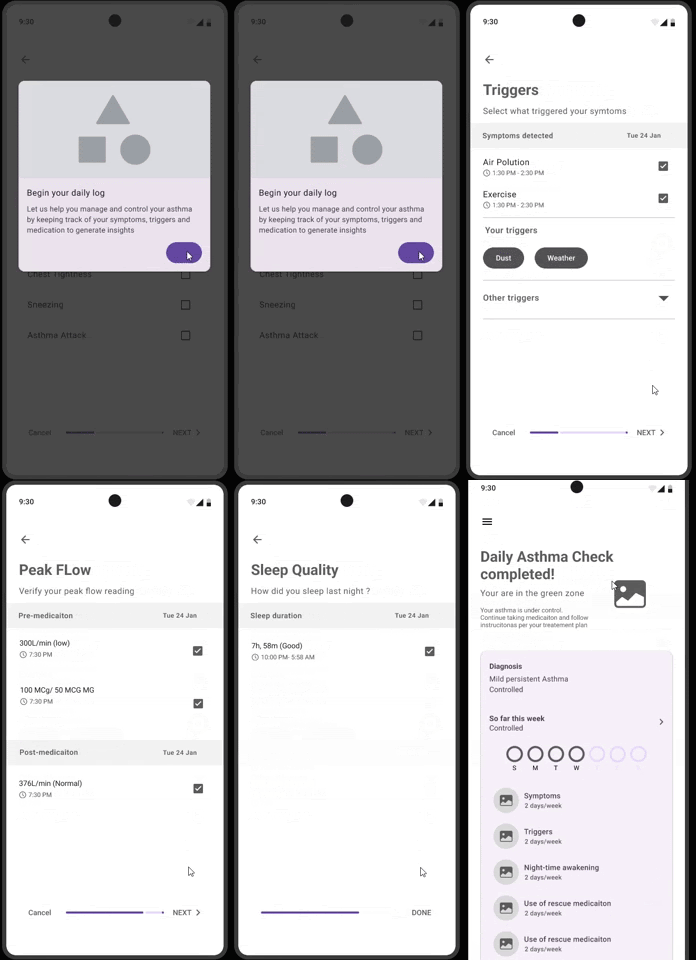
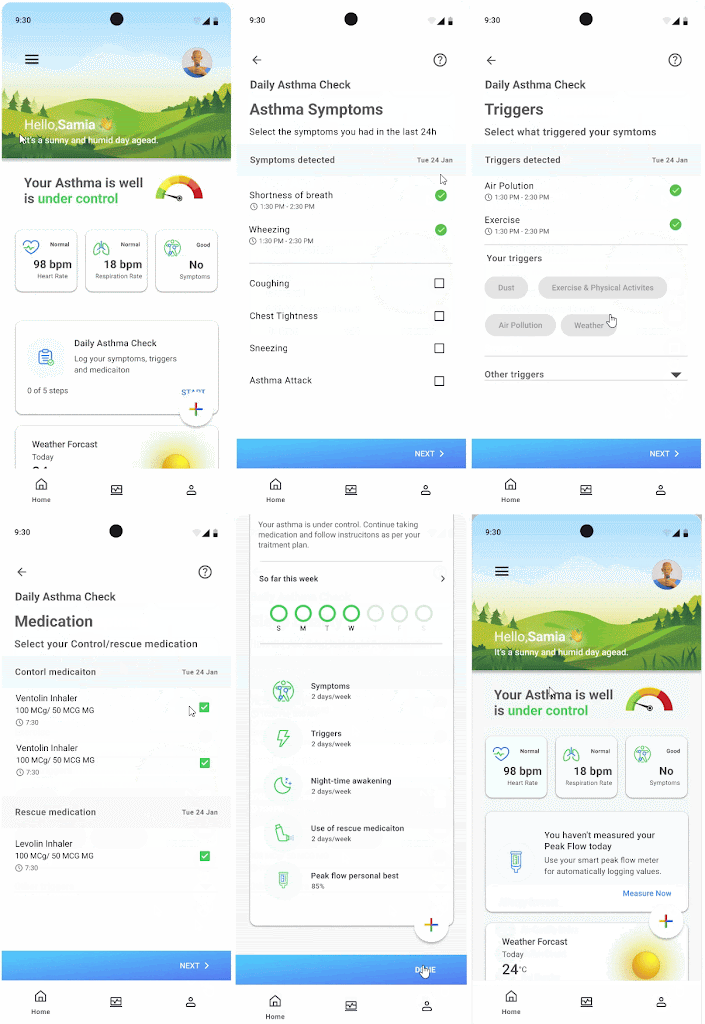
Flow 3: Daily Asthma Check
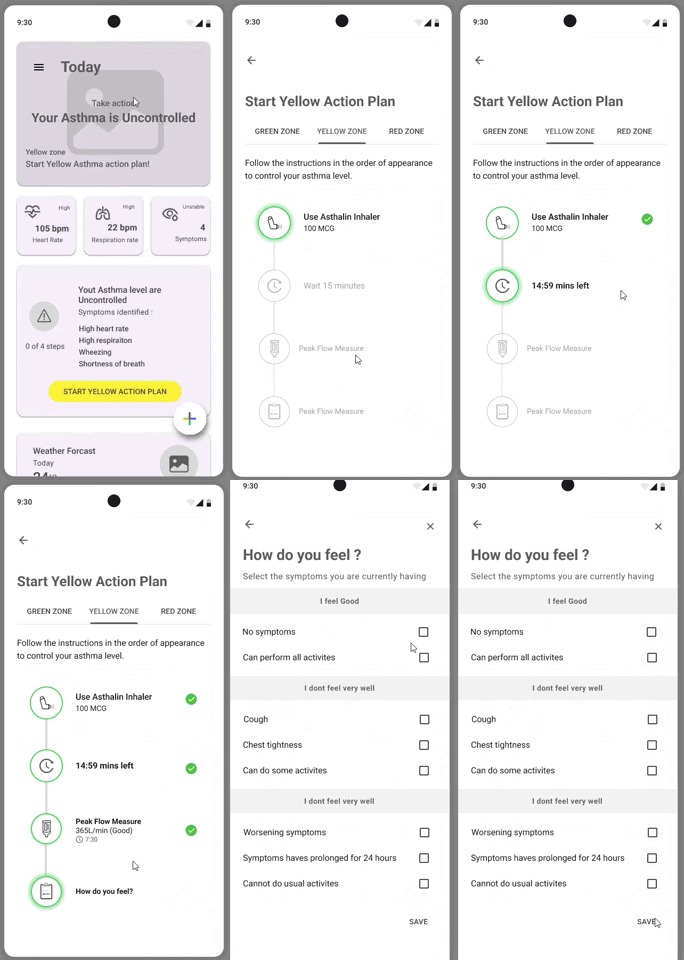
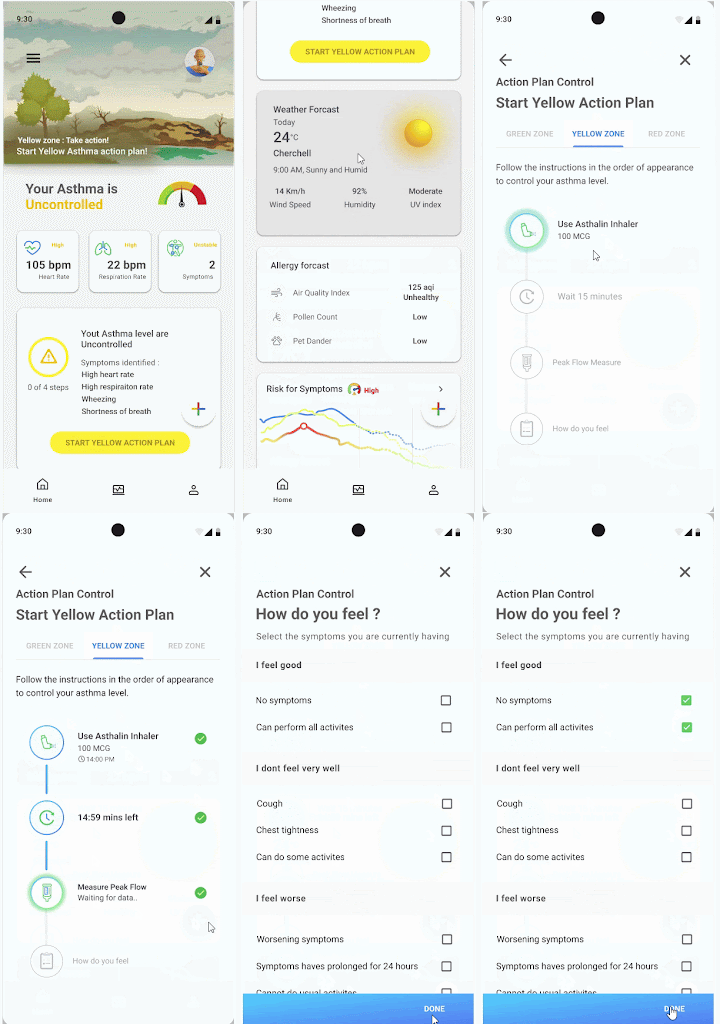
Flow 4: Start Yellow Aciton Plan
Mid Fidelity wireframes
Flow 4: Start Yellow Aciton Plan
Mid Fidelity wireframes
Stage 4 | Prototype
I created a working high fidelity prototype of the designed screens using Invision. The task flows observed in the prototype are :
Task Flow 1: Onboarding
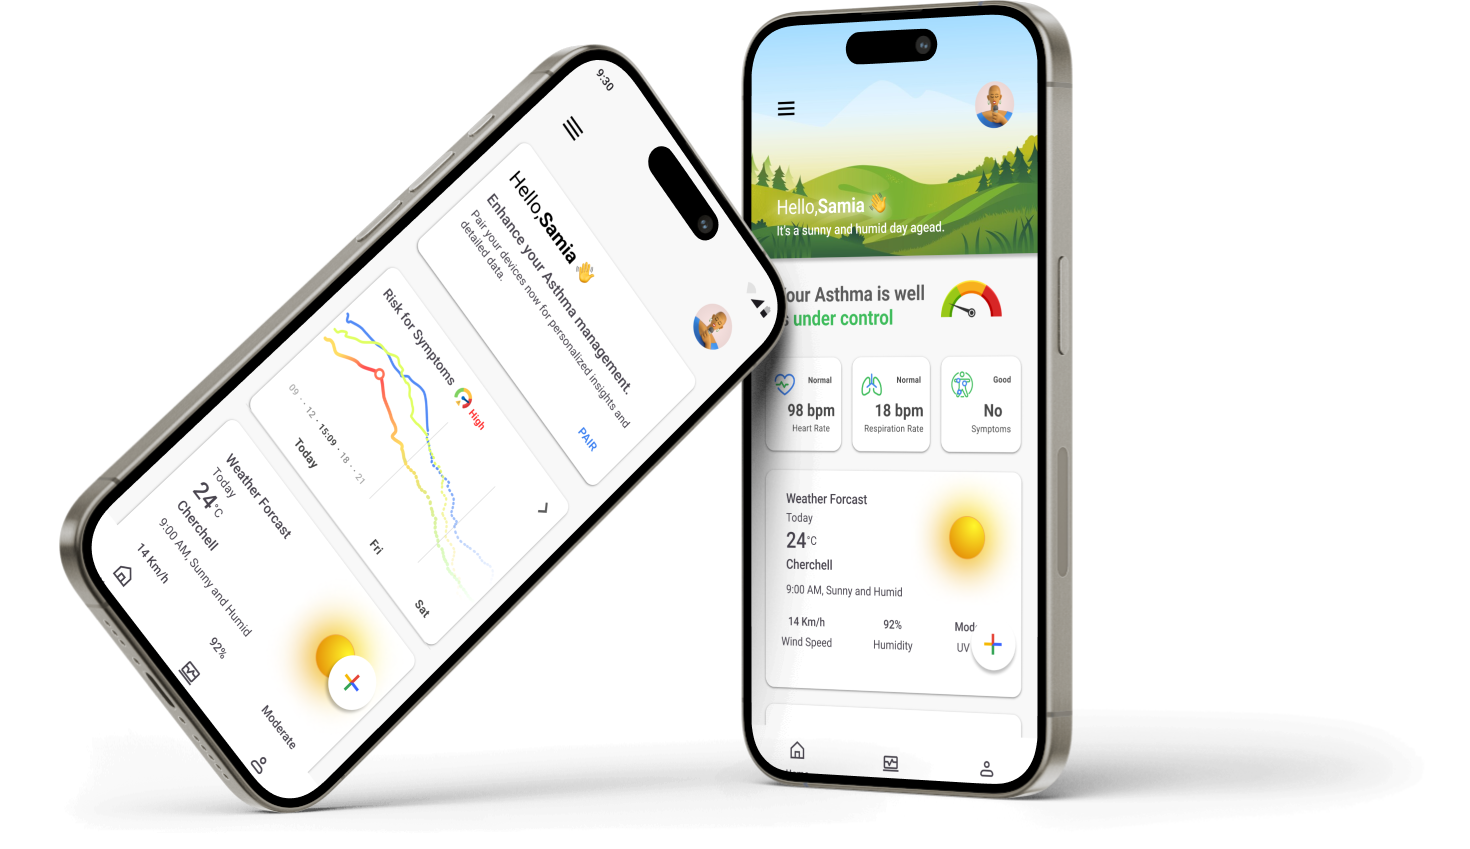
Participants will begin by selecting their user type: careseeker or caretaker. For this test, assume the participant selects the careseeker option. They will then specify their type of asthma and identify triggers. Participants will have the option to pair the Google Aria smart devices (smart inhaler and smart peak flow meter) and explore the home page afterward that contains personalized insights and detailed data about all their vitals.
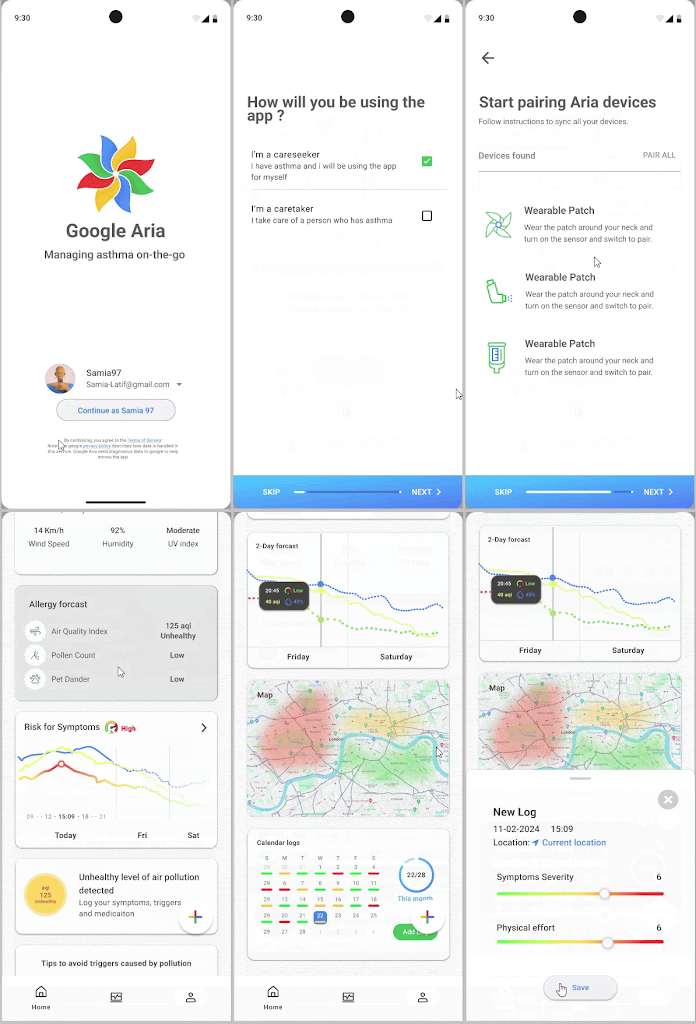
Alternatively, participants can choose not to pair devices but can still benefit from data about asthma management applications, including the risk of symptoms feature using other Google APIs integrated features into the app.
with pairing devices
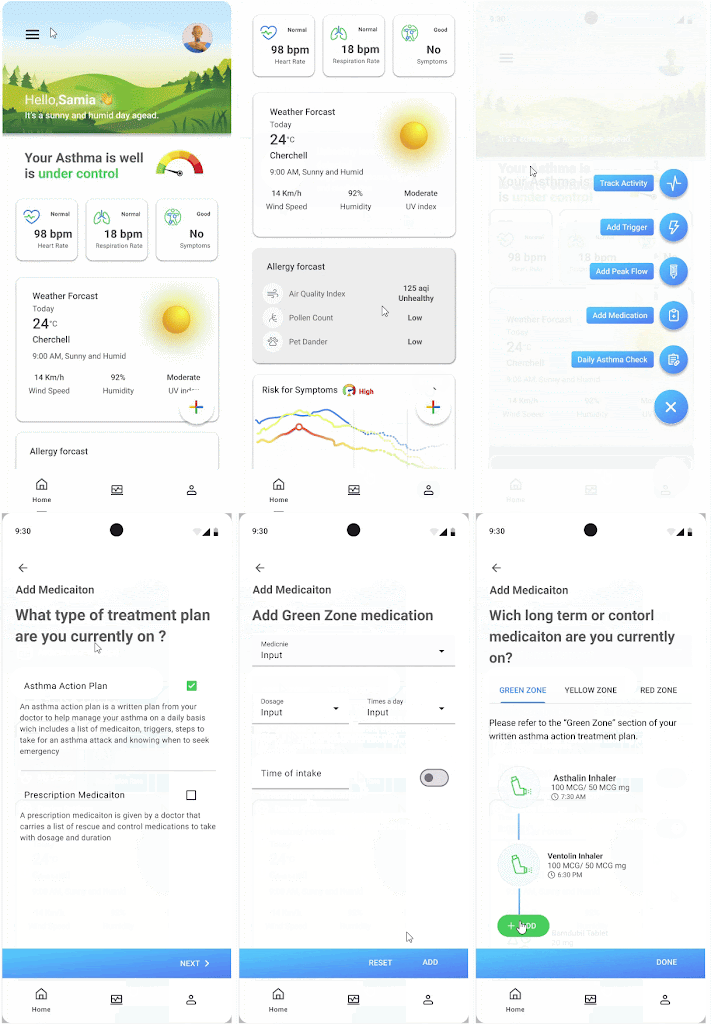
Task Flow 2: Medication Management
Participants can add their current medication details for each action plan (green/yellow/red) to the app, with the possibility to set reminders.
Task Flow 3: Daily Asthma Check.
Participants can log their daily treatment progress within the app. Additionally, the daily asthma check feature provides information from the devices paired with the phone, displaying detected symptoms and triggers. After logging all the information, the app can determine if the participant's asthma is under control based on the provided and detected data.
Task Flow 4: Yellow Action Plan Activation
In this scenario, the app detects unmanageable asthma symptoms. Participants will follow the steps of the yellow action plan to regain control of their asthma.
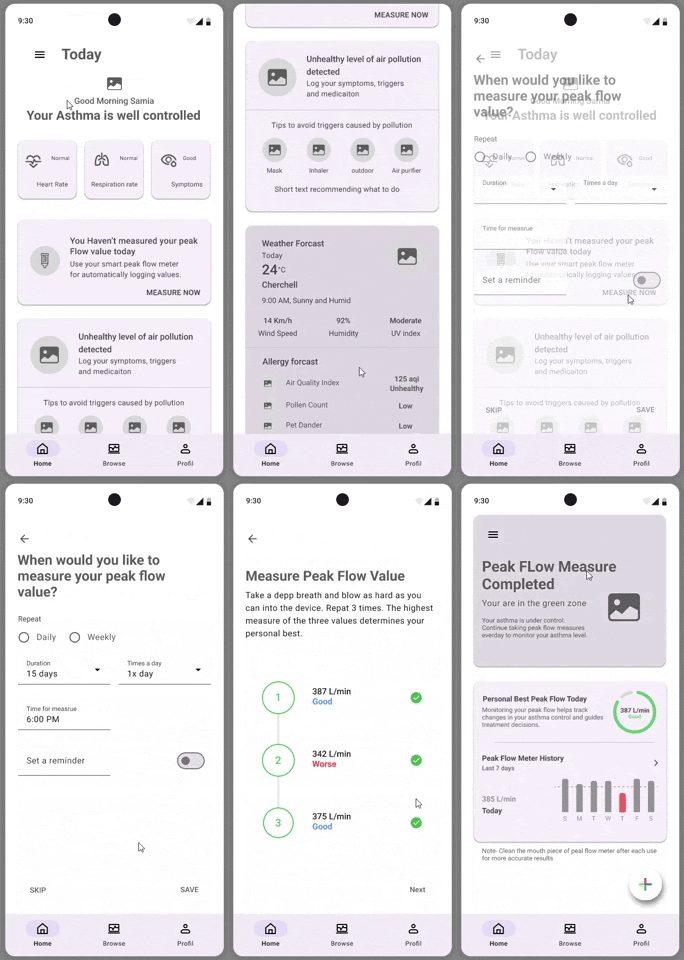
Tassk Flow 5: Peak Flow Measurement
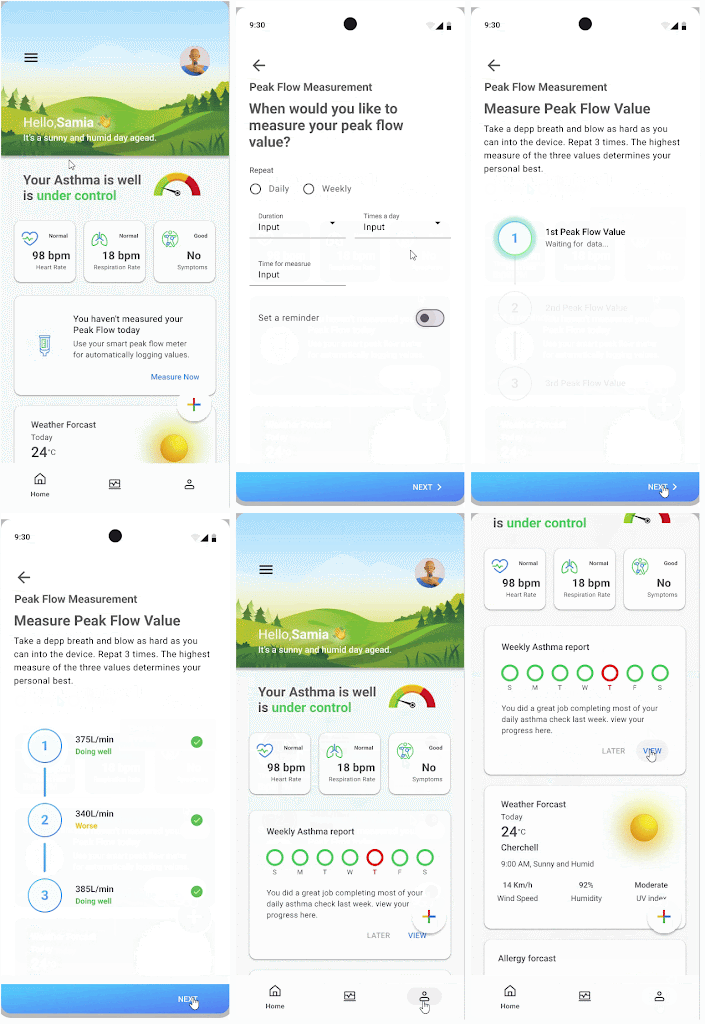
Participants can access information about measuring peak flow and determine their personal best reading. The user can view their peak flow history and share it directly with their doctor for review.
without pairing devices
Task 2
Task 4
Task 3
Task 5
Stage 5 | Test & Iteration
The high fidelity prototype of the Google Aria application underwent a usability test to evaluate aspects such as usability, navigation, content, and call-to-action within the established task flows.
The goal was to detect errors, gather user feedback on preferences and recommendations, and evaluate the overall success of the prototype. The test was administered through in person setting, involving participants previously recruited for user research, all of whom were individuals with asthma.
The findings from the test played a crucial role in pinpointing areas that needed improvement in user interaction and uncovering potential error states. Subsequently, adjustments were made to the prototype to integrate the modifications outlined in the affinity map.

